Table of Contents
Image montage UI
Motivation
While for data inspection the screen resolution (e.g. 1mm equals one pixel for the 3-slices view) is sufficient, paper-based publication (articles, posters, etc.) usually require much higher resolution images (e.g. at least 150 dpi, which means that for those pictures, a super-sampling of at least factor 6 is required to get 25.4 * 6 = 152.4 pixels into one inch!).
As the main UI does not allow that kind of high-resolution zoom, a different UI is available for this task.
Layout
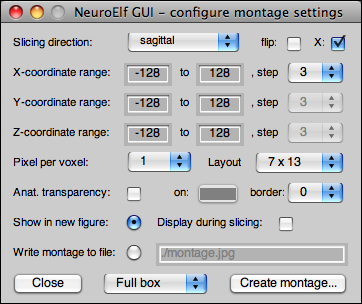
The image montage UI is available via the Visualization → Create montage images menu item and looks like this:
This dialog has the following controls and properties:
- slicing direction (supports sagittal, coronal, and axial/transversal)
- flipping of slicing direction (non-flipped:
min:step:max, flipped:max:-step:min) - X-flip (for coronal/axial slicing, flip along dataset's X axes, orientation)
- X/Y/Z coordinate range (set minimum value and step to 'S' for single slice image)
- super-sampling factor (up to 8)
- montage packing layout (default: letter formatted output)
- re-setting background color (replacing black with a color, incl. smoothed border support)
- adding up to 10 pixels of additional border between images
- either show output or write to file (using
imwrite, different formats supported) - pre-defined volumes to cover the brain of different template spaces
Configuration example
This is a typical usage example. Make sure to configure the statistical map(s) with the correct threshold (stat, k), colors, etc!
- for the MNI brain, the drop-down can be set to
MNI brain, which then sets- X, Y, and Z min/max to -78/78, -110/82, -64/92
- using the configured step-size to determine number of slices
- sets a new default layout (and updates the layout dropdown choices)
- enabling X-flip
- choosing a step-size of
3sets the layout default option to6 x 9 - setting the super-sampling factor to 4
- enabling anatomical transparency
- choosing a new background color R: 40, G: 100, B: 160 (middle-light blue)
- adding 6 pixels of border
- choosing
Show in figure - disabling (if necessary)
Display during slicingoption - click on
Create montage…
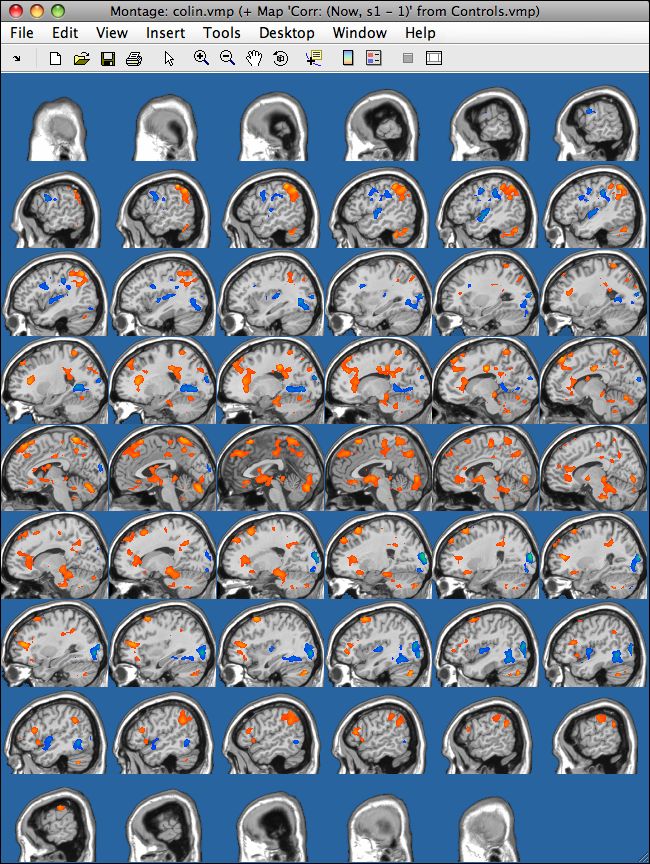
The output then looks like this (for a random covariate thresholded with r >= 0.275)
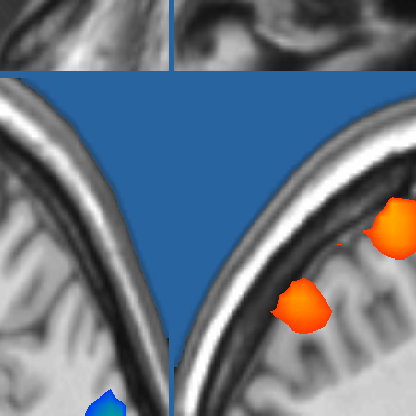
And a zoomed snippet (using Matlab's internal zoom/lens button) reveals the sub-millimeter resolution and the shaded transparency of the border:


