Table of Contents
NeuroElf main UI
Motivation
While the toolbox is primarily written for advanced users who know there way around Matlab and are able to make full use of the toolbox functionality, the need for a rudimentary graphical user interface (GUI) arose soon after introducing the toolbox to my fellow lab members.
neuroelf_gui is the response to that need and might, in future versions, show extented capabilities.
GUI layout
The GUI comes in two modes, full and minimized (whereas minimized removes some UI elements from the figure so as to save some space for other windows).
To bring up the GUI, simply issue the
% bring up NeuroElf GUI
neuroelf_gui
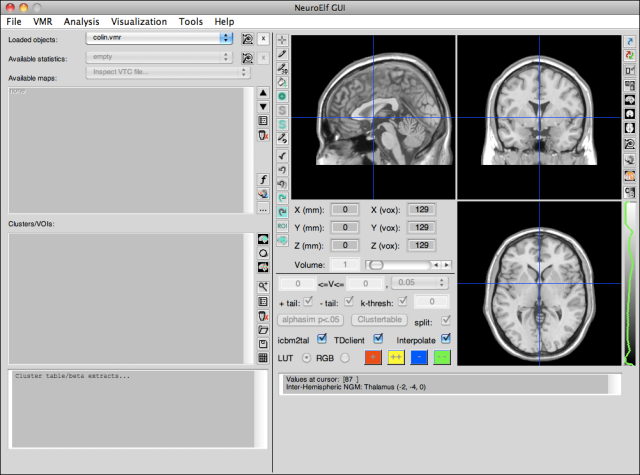
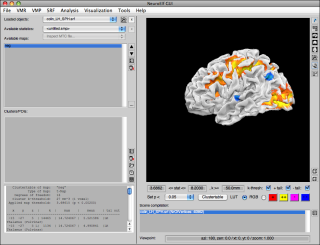
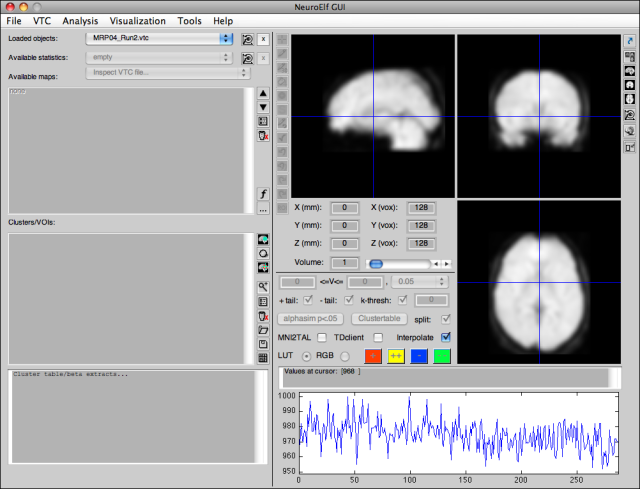
call. It will take a couple of seconds (especially if the xfigure class needs to be run-time compiled by Matlab on its first call), after which the following UI figure will appear (watch the video on the right hand side, also available in full resolution):
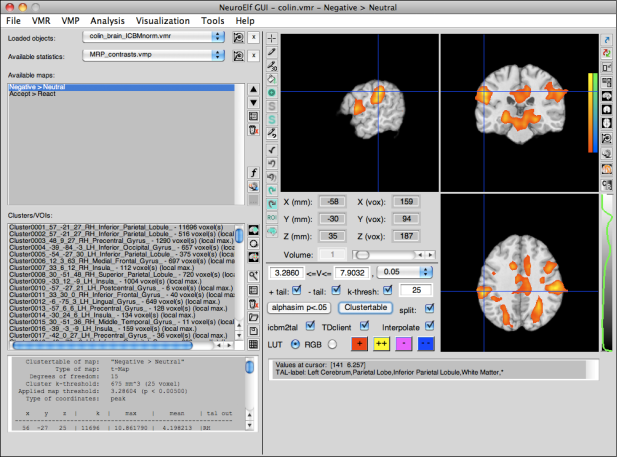
After creating some additional files (see neuroelf_makefiles for more instructions), loading or creating some statistical map (and, in this case, the newly created Colin brain VMR) and using the Clustertable functionality, the display has more buttons un-grayed:
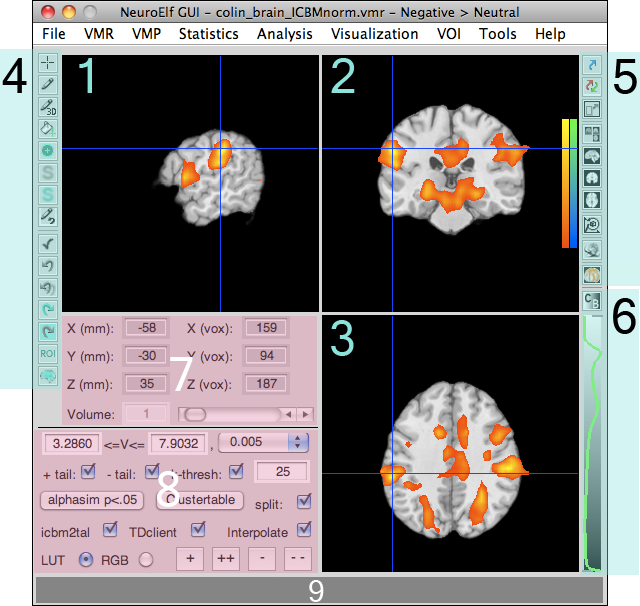
Here is a full-resolution version with numbered areas which are explained below:
The numbered sections in turn mean:
- dataset selection (among loaded objects)
- statistical map selection (multi-select capable)
- (a) configured clusters/regions of interest and (b) output of cluster table (only for HDR/HEAD/VMP format at this time) or beta extracts (only for RFX-GLM objects)
- progress bar area (only visible if a long-running task is executed)
- drawing tools (only HDR/NII/VMR at this time)
- view (page) selection buttons and global transformation configuration
- contrast/brightness setting (button and slider axis)
- cursor position in space (TAL/MNI coordinate and BV system coordinate, as well as volume selector)
- configuration of statistical map (only VMP format at this time)
- output of values at current cursor position (anatomical and statistical values of all selected maps)
- optional time course display if selected dataset is functional and multi-volume (FMR, 4D NII, and VTC)
- canonical slicing of anatomical (or functional + optional statistical) dataset(s)
- a) sagittal view
- b) coronal view
- c) axial/transversal view
Dataset selection (1)
The dropdown controls allow to select any of the loaded datasets as the currently active dataset (both for anatomical and statistical datasets). Currently supported are
- as anatomical datasets
- FMR (BrainVoyager's Functional MR format)
- HDR/NII (Analyze/NIftI format, incl. 4D NIftI files)
- HEAD (AFNI's BRIK/HEAD format, anatomical auto-detect)
- MSK (BrainVoyager's Mask format)
- VMR (BrainVoyager's Volumetric MR format)
- VTC (BrainVoyager's Volumetric TimeCourse format)
- as statistical datasets
- CMP (BrainVoyager's Component Map format)
- GLM (BrainVoyager's General Linear Model format)
- HDR/NII (Analyze/NIftI format, requires special tokens in description or settings in
RunTimeVars) - HEAD (AFNI's BRIK/HEAD format, statistical auto-detect)
- VMP (BrainVoyager's Volumentic Map format)
In addition to the selection, for each dataset a transformation quaternion (origin) can be set separately, in case datasets from different programs are not initially compatible (3D transformation button). Once a dataset is no longer required in the list, it can be removed from the dropdown (using the x-button).
Statistical map selection (2)
Once an object is loaded suitable for statistical map overlay, the maps therein can be displayed, also supporting a multi-selection of maps. Additionally, the following actions are supported:
- moving maps within their container (HEAD and VMP format, arrow up and down buttons)
- setting map properties (VMP format only, properties button)
- deleting maps from their container (HEAD and VMP format, trashcan button)
- computing a formula on the available map data (VMP format only, f-button, see vmp.ComputeFormula for more info)
- sampling the selected maps as surface maps (SMP) for the currently visible surfaces (SRF objects selected in Scenery listbox)
- propagating the map condition selection for other subjects (GLM format, ellipse-button)
Configured clusters and table output (3a/3b)
Below the map area is the listbox that contains the currently configured clusters (comparable to BrainVoyager's ROI dialog). Each time the Clustertable button in the stats area is used, the clusters will be overwritten, so make sure to save any desired/altered list of clusters before using the Clustertable function again!
The buttons next to the cluster list are (from top to bottom)
- mark cluster (sets voxel values in VMR project to specific code)
- restrict cluster (restricts the cluster to either a box or sphere around the first/peak voxel)
- find nearest peak (computes distances between current position and cluster peaks and selects closest peak/cluster)
- zoom on/off (enables a zoomed view on that cluster (potentially useful for screenshots with all three slicing views)
- cluster properties (edit cluster properties)
- delete selected clusters
- load cluster configuration
- save cluster configuration
- extract betas from currently selected GLM for selected clusters (auto-extract is enabled by default)
Below the list of clusters is a multi-line text edit field which contains
- a text version of the clustertable after pressing on the Clustertable button (potentially also showing the nearest gray-matter Talairach label for each coordinate)
- a table of extracted betas (also showing each subject's name and the label of the cluster from which the data was drawn)
Progress bar (4)
For some longer-running tasks (e.g. alphasim or robust regression of contrasts), a progress bar is shown and updated regularly. This allows the UI to remain mostly function (browsing, shorter tasks) while a longer task is completing in the back-ground.
Dataset manipulation buttons (5)
From top to bottom, these buttons are associated with the following actions/settings:
- browsing mode (drawing disabled)
- 2D drawing mode (drawing within the slice that is clicked into)
- 3D drawing mode (drawing across slices, spherical or cubic around the clicked coordinate)
- floodfill (3D flood-filling of voxels that match the selected criteria)
- marker expansion (expanding the marked selection in a dilation fassion)
- smoothing of the gray-scale data (allowing a coordinate and value range selection, as well as setting a smoothing kernel)
- smoothing (the marked selection is smoothed to remove rough edges)
- undo drawing en/disable (drawing takes back values from the buffer)
- accept changes (copy current version into undo buffer)
- undo (copy undo buffer into current version)
- reload (reload dataset from disk)
- reload marked (reload dataset from disk and mask with marked color)
- reload unmarked (reload dataset from disk and inverse-mask with marked color)
- defining a new ROI (cluster) to be added to the list of clusters (VOI list)
- setting the underlay object
View / Page selection (6)
The main UI has three different views:
The view/page selection buttons, from top to bottom, mean:
- undocking (create a secondary, satellite figure containing the current view, allowing to investigate multiple maps/datasets, potentially at the same coordinate via linked browsing)
- toggle between linked and linked browsing (state obversable)
- minimize/maximize window
- switch to three-slice view (page 1, default on startup)
- switch to sagittal-zoomed view (page 2, SAG)
- switch to coronal-zoomed view (page 2, COR)
- switch to axial-zoomed view (page 2, TRA)
- set global spatial transformation parameters (in case data comes from a different program)
- switch to surface rendering view (page 3)
- invoke voxel-based rendering dialog
Minimized mode
Upon clicking the third button (which will be replaced with a different version), the window will convert to minimized view (if it is in full mode, that is):
The elements on the left side of the figure (file/map selector, cluster and table output) will be hidden from view to free up some space for other windows. The following sections remain:
- sagittal view
- coronal view
- axial/transversal view
- drawing tools
- view/page selector
- contrast/brightness slider (and settings button)
- current position
- statistics configuration
- progress bar area
Contrast/brightness setting (7)
It is now possible to change the contrast and brightness of a voxel-based anatomical object (FMR, HDR, HEAD, VMR) without changing the underlying data. To do so, you can click the C/B button, which allows the user to set the minimum value (black) and maximum value (white) for the scaling function, as well as the possible minimum and maximum value (slider range).
Alternatively, you can click into the slider containing a (vertically aligned) histogram of all non-0 voxels of the dataset. When clicked closer to the maximum slider, the maximum can will be reset to the clicked position (which also works while the mouse button is held down to fine-tune the selection), and when the click occurs closer to the lower slider, the minimum is re-set.
Cursor position in space (8)
The six spatial coordinate edit fields show and allow to set the current position (cursor/crosshair) in either TAL/MNI spatial convention (coordinate origin is the center of each slice at coordinate [0, 0, 0]) or the actual sampling coordinate of the dataset (coordinate origin for BrainVoyager objects is located in the upper, frontal and right “corner”, so that the TAL-based center for a full-space VMR dataset is at BV coordinate [129, 129, 129]). Currently only integer coordinates are supported for input (but the zoomed view allows for interpolated/non-integer coordinates to be shown of course).
Additionally, for four-dimensional datasets, a volume selector and edit field allows to change the currently shown volume.
Configuration of statistical maps (9)
The first row of controls allows to set minimum and maximum thresholds for coloring the statistical map (any value below the minimum will not be shown, values above the maximum will be shown in the color of the maximum), and if the type and degrees of freedom of a statistical map is well-configured, one of the pre-defined probability threshold values can be selected as well (which automatically honors the number of tails selected below for one- or two-tailed statistical thresholding).
In the second row, the positive and negative tails of the configured map can be en- and disabled separately, and also the cluster size threshold can be set and dis/enabled. Note: whenever the cluster size thresholding is enabled, the values of the map will be set to zero for all non-clustered areas, which then is reflected in the Sampled values box!
The further controls are
- the
alphasim p<.05button uses the current map as a template (values non-equal to zero) and runs alphasim with that template as a mask (using the correct spatial resolution) to determine the required cluster size threshold for the more typical uncorrected p-thresholds (results printed in the Matlab console window) - the
Clustertablebutton will call the vmp.ClusterTable method for the currently select map (only for single map selection) and update the configured clusters list as well as the table output field. The checkbox right of the button dis/enables the splitting of larger clusters into sub-clusters, for which the peaks will be reported separately if enabled; optional setting for the Clustertable output can be set via the File → Options → Clustertable sub-menu - the
icbm2talcheckbox controls whether, for any created cluster table, coordinates are converted from ICBM into TAL space/convention (by applying the icbm2tal function) - the
TDclientcheckbox controls whether, for any created cluster table, coordinates are passed on to tdclient, so that for each peak the nearest gray-matter label is looked up - the
Interpolatecheckbox controls whether statistical maps are interpolated into the spatial resolution of the UI (1x1x1 mm) or sampled with nearest-neighbor sampling - the
LUTandRGBradio buttons alter the statistical-value to color coding from lookup table (LUT) to RGB color range - if the color coding is set to RGB, the colors for positive and negative minimum and maximum values (thresholds) can be configured using the four colored buttons
Output of values (10)
This box simply contains the sampled value at the current (cursor/crosshair) position, both for the selected anatomical and any selected statistical map.
Time course display (11)
For four-dimension datasets, this area displays the time course at the current (cursor/crosshair) position. A click into the timecourse will also set the volume selector to that position (which works more interactively than using the volume slider, as this requires the mouse button to be released!)
Slice display (12a/b/c)
In both the three-slices view and the zoomed one-slice view, any click into one of the slices will set the cursor to the clicked position within the slice. This allows for relatively simply browsing of the dataset. The position will keep updating while the mouse button remains pressed (and the mouse moved).
To reset the slice display to its original position (central coordinate), press the r key on the keyboard.
Surface display (12)
For the surface display, the following viewpoint modifications are supported with the mouse (while the mouse button is pressed within the surface area and remains pressed throughout the mouse motion):
- without any modifier key pressed, the view will rotate (along the Z axes for left/right mouse movement → longitude/azimuth, and along a perpendicular spatial axis → latitude/zenith)
- with the
SHIFTkey pressed, the view will translate (shift) with the mouse movement - with the
ALTkey pressed, the view will zoom (up → smaller, down → larger; intuitively as if the object were moved away/toward the user along with the mouse)
To reset the surface display to its original view (azi: 180, zen: 0, zoom: 1), press the r key on the keyboard.
Keyboard commands
When no control is currently selected (click between controls, into the background of the figure), the following keyboard commands are supported:
- cursor left/right: for slice-based view change the current (cursor/crosshair) position in X direction +/- 1; for surface view rotate azimuth/longitude by +/- 5
- cursor up/down: for slice-based view change the current (cursor/crosshair) position in Z direction +/- 1; for surface view rotate zenith/latitude by +/- 5
SHIFT+ cursor left/right: for surface view translate view by +/- 5SHIFT+ cursor up/down: for slice-based view change the current (cursor/crosshair) position in Y direction +/- 1; for surface view translate view by +/- 5ALT+ cursor up/down: for slice-based view change alpha-blending in 0.1 increments up/downCTRL+ cursor up/down: for surface view zoom by factor 1.01/0.99akey: toggle crosshair display on/offckey: toggle cluster-check for current map on/off (same as checkbox, which is automatically updated)ikey: toggle interpolation on/off (same as checkbox, which is automatically updated)jkey: switch between multi-map join modes: color-sum-blending and later-map-winslkey: toggle cluster-split checkbox on/offmkey: switch between interpolation methods: trilinear and cubicnkey: negate alpha-blending option, possibly auto-level for multi-map selectionokey: toggle between radiological and neurological display conventionrkey: reset viewskey: toggle between minimized and full viewtkey: switch through three-slices view and the three single-slice zoomed views (order: 3-slice, sagittal, coronal, axial/transversal)ukey: toggle undo drawing on/offxkey: switch cluster auto-beta-extraction on/offzkey: toggle brain zooming flag (for cluster-based zoom)1key: toggle positive statistical tail on/off2key: toggle negative statistical tail on/off
Menus
For a list of menu items, please continue to the menu tree page.
